Everyone knows a good budget is integral to overall financial success – being able to account for every single penny going in and coming out. But what about when you’re $20 trillion in debt, and your monthly expenses need to account for the more than 325 million people living in the U.S.? That’s just a sample of what it’s like to think about the mandatory and discretionary spending budgets in America.
But what if we asked you to guess these budgets, and to consider where the money comes from in the first place and where it goes when all’s said and done? To find out, we surveyed 1,000 Americans to break down the U.S. budgets according to their own knowledge and desires and then compared them to actual budget allocation. You’ve heard how politicians think the money should be spent – now read on to discover what the American people think about this big budget.
Cut It or Keep It
The national budget is broken into two categories: mandatory and discretionary spending. Entitlement programs that have been written into law (like Social Security or Medicare) are considered mandatory spending and aren’t required to pass through appropriations legislation to earn funding. In contrast, discretionary spending includes anything subject to any appropriations committee annually and accounts for one-third of the total budget spending. For the 2018 fiscal year, the mandatory spending budget is estimated to be $2.535 trillion and $1.244 trillion for discretionary spending.
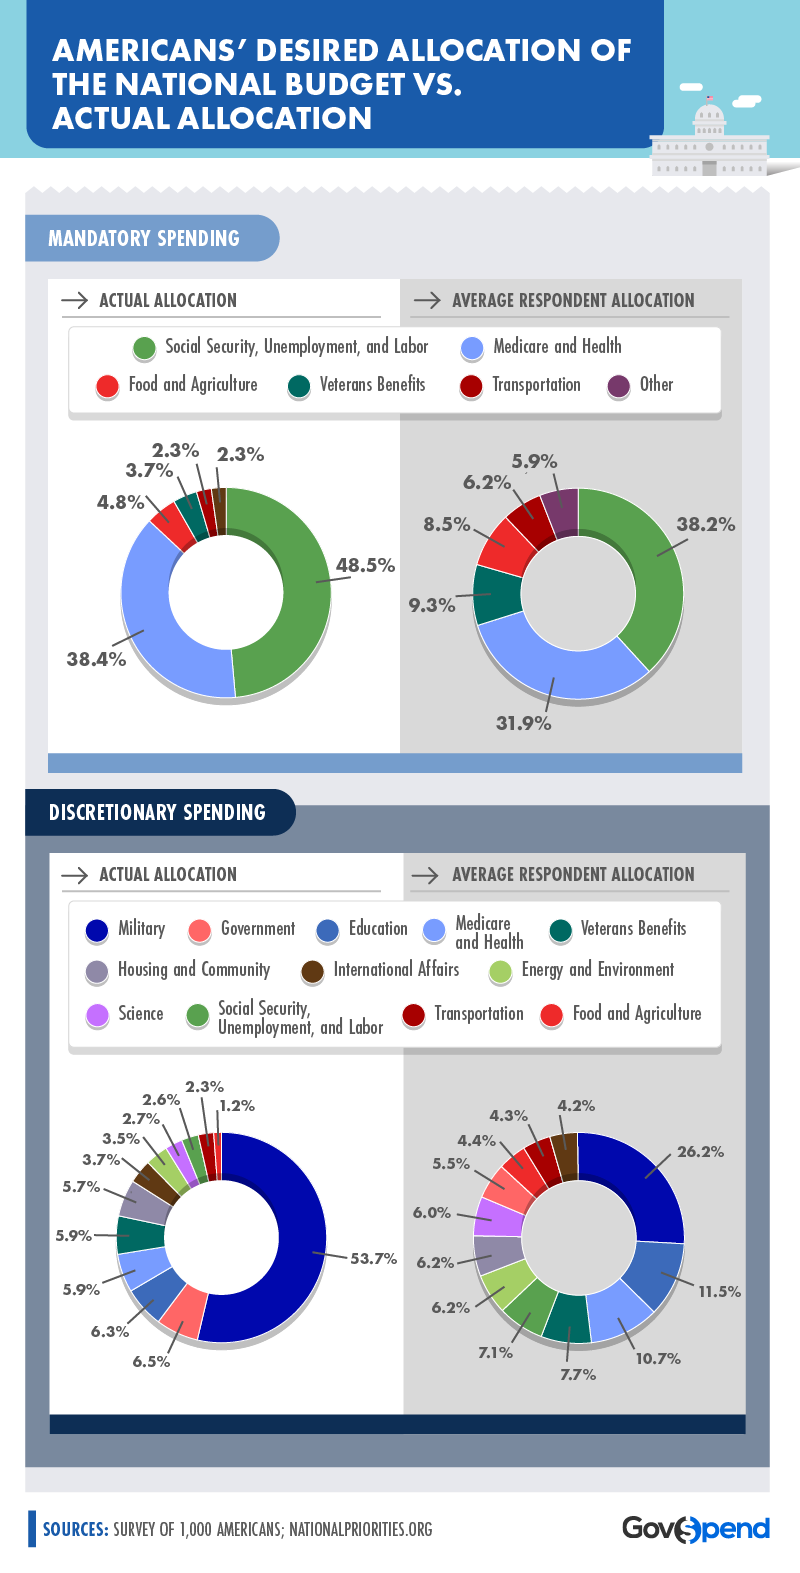
Interestingly, Americans had very different ideas about how that mandatory money should be allocated compared to how it’s spent today. Men and women believed less money should be spent on Social Security and Medicare, while spending on programs for veterans, food and agriculture, and transportation should roughly double. Accounting for nearly half of the entire budget, Social Security accounts for over $1 trillion in federal mandatory spending alone.
As for discretionary funding? Americans thought military spending should be cut in half and education, science, and energy and environment deserved to be roughly doubled or more. According to the 2018 fiscal budget, Department of Defense spending will equate to over $639 billion, while education will account for $59 billion.
Expectation vs. Reality
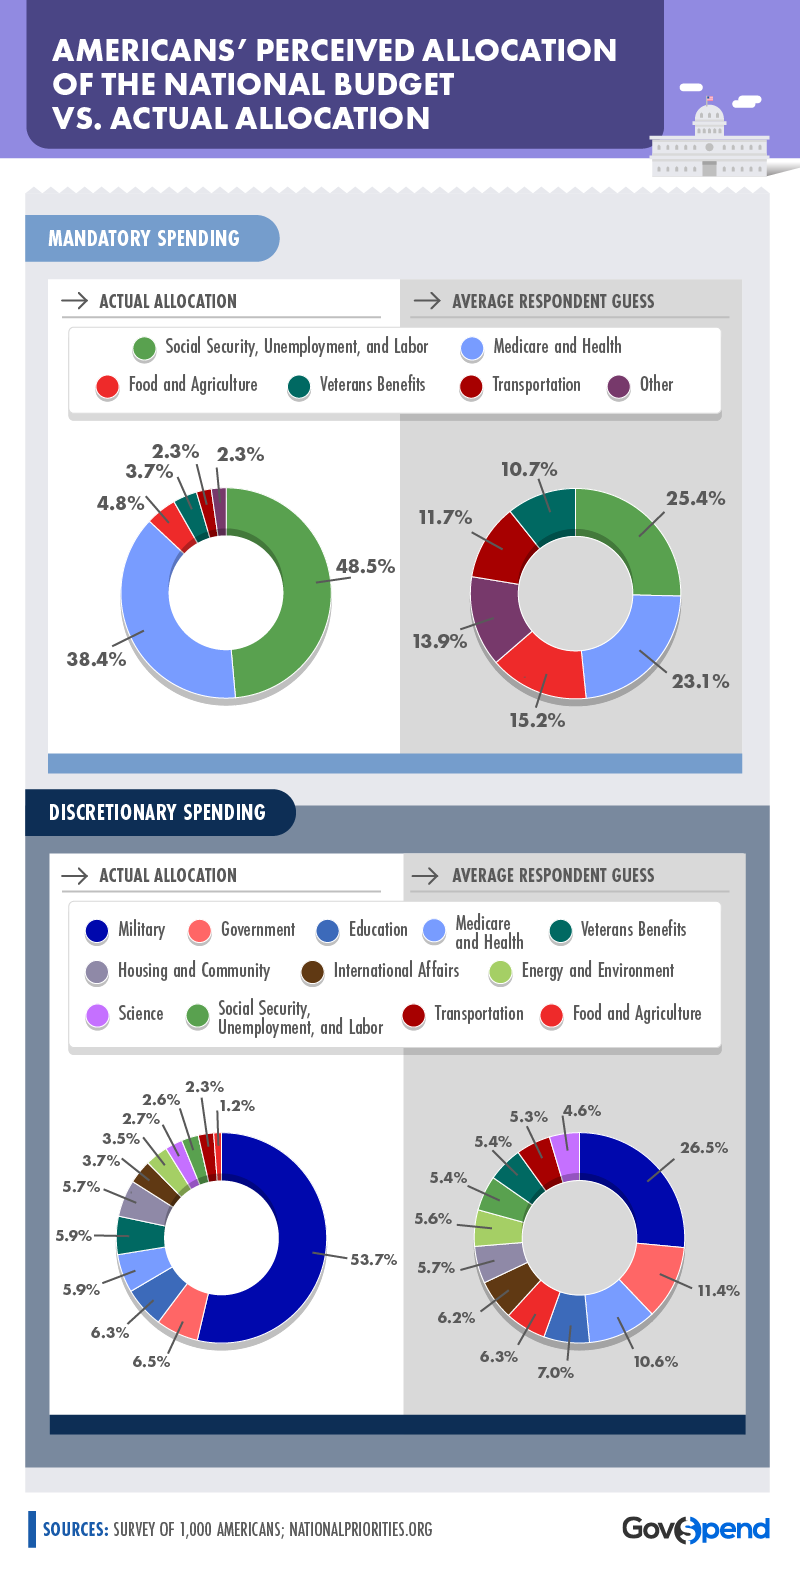
When guessing how U.S. dollars were spent, Americans believed overall spending was more evenly dispersed than it actually was. While they estimated a little over 48 percent was being used toward Social Security and Medicare combined, Social Security actually equated to nearly 49 percent of the budget on its own. They also guessed veterans benefits (which include general compensation, insurance, and pensions) would account for almost 11 percent of federal mandatory spending; however, it only added up to less than 4 percent of the actual budget.
Discretionary spending was equally as skewed by most Americans’ perceptions. Guessing the budget for military spending was only half its actual cost, most people believed spending in other areas was significantly more compared to reality. People assumed international affairs and government spending were higher, but the federal budget allocated roughly half of what Americans expected for transportation and sciences and nearly one-fifth of what they guessed for food and agriculture.
A Partisan Divide
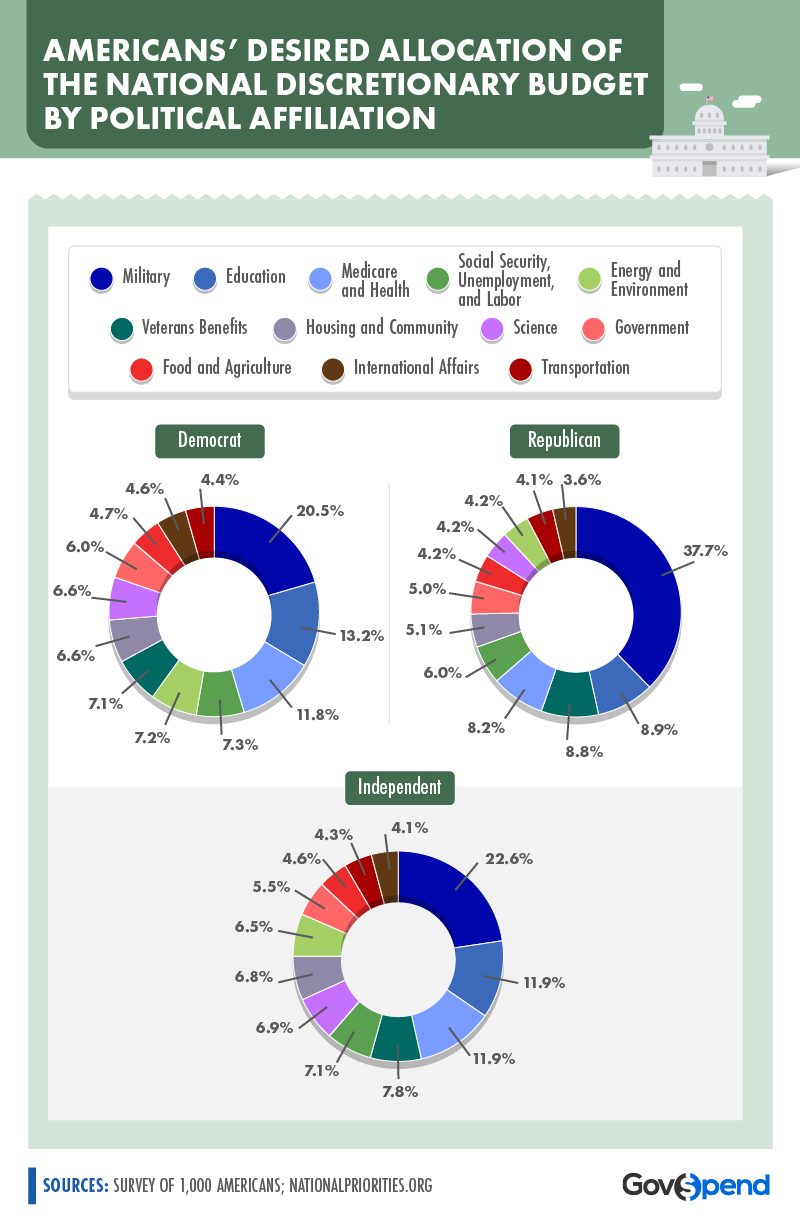
Roughly 3 in 4 Americans are afraid of the potential for a full-scale war with North Korea, but according to our survey, the average Democrat or Republican believes the U.S. commits too much of the national budget to military spending. Based on 2016 expenditures, the U.S. spent $611 billion on defense spending – the most in the world and more than the eight countries that followed (including China and Russia) combined.
Research has found more Americans favor bigger government over a smaller presence and more spending on public services like education and infrastructure. While surveyed Americans of all political persuasions said education should be the second highest expense in discretionary spending, the average Democrat indicated educational expenses should be the highest compared to the other political affiliations (at just over 13 percent). Today, funding for education accounts for 6 percent of the national discretionary budget.
Republicans were the only group to suggest veterans benefits were deserving of more funding than Medicare and health spending, and Independent voters believed spending for science and housing and community should be higher than what either Democrats or Republicans allocated.
Finding the Right Balance
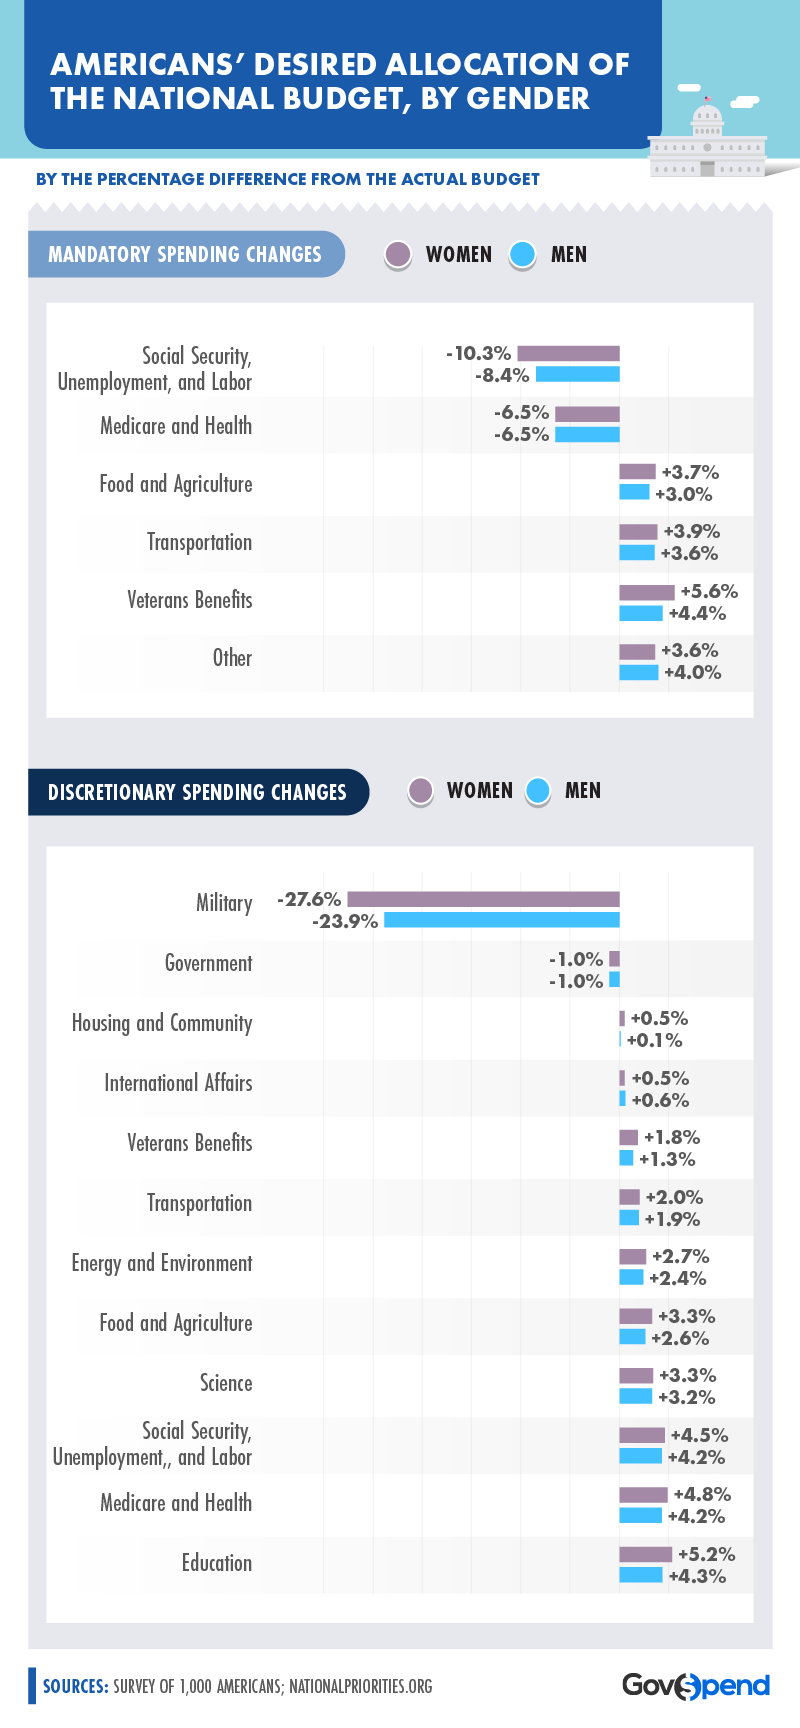
Where national mandatory spending is concerned, surveyed men and women would decrease spending in only two of the six spending categories we asked them about: Social Security and Medicare and health. Women were more inclined to reduce spending toward Social Security, while both genders agreed Medicare costs should be scaled back by 6.5 percent on average.
While men and women agreed spending on veterans should be increased, women said discretionary military spending should be reduced by nearly 28 percent compared to less than 24 percent for men. With over $600 billion in funding, a majority of that money is spent maintaining U.S. military bases and basic daily operations each year. In 2015, $40 billion was spent on aircraft systems, and $22 billion was contributed toward shipbuilding and maritime systems.
Men and women said 10 of the 12 categories included in the U.S. discretionary spending budget deserved more money, with the biggest increases going toward Social Security, Medicare and health, and education.
Generational Priorities
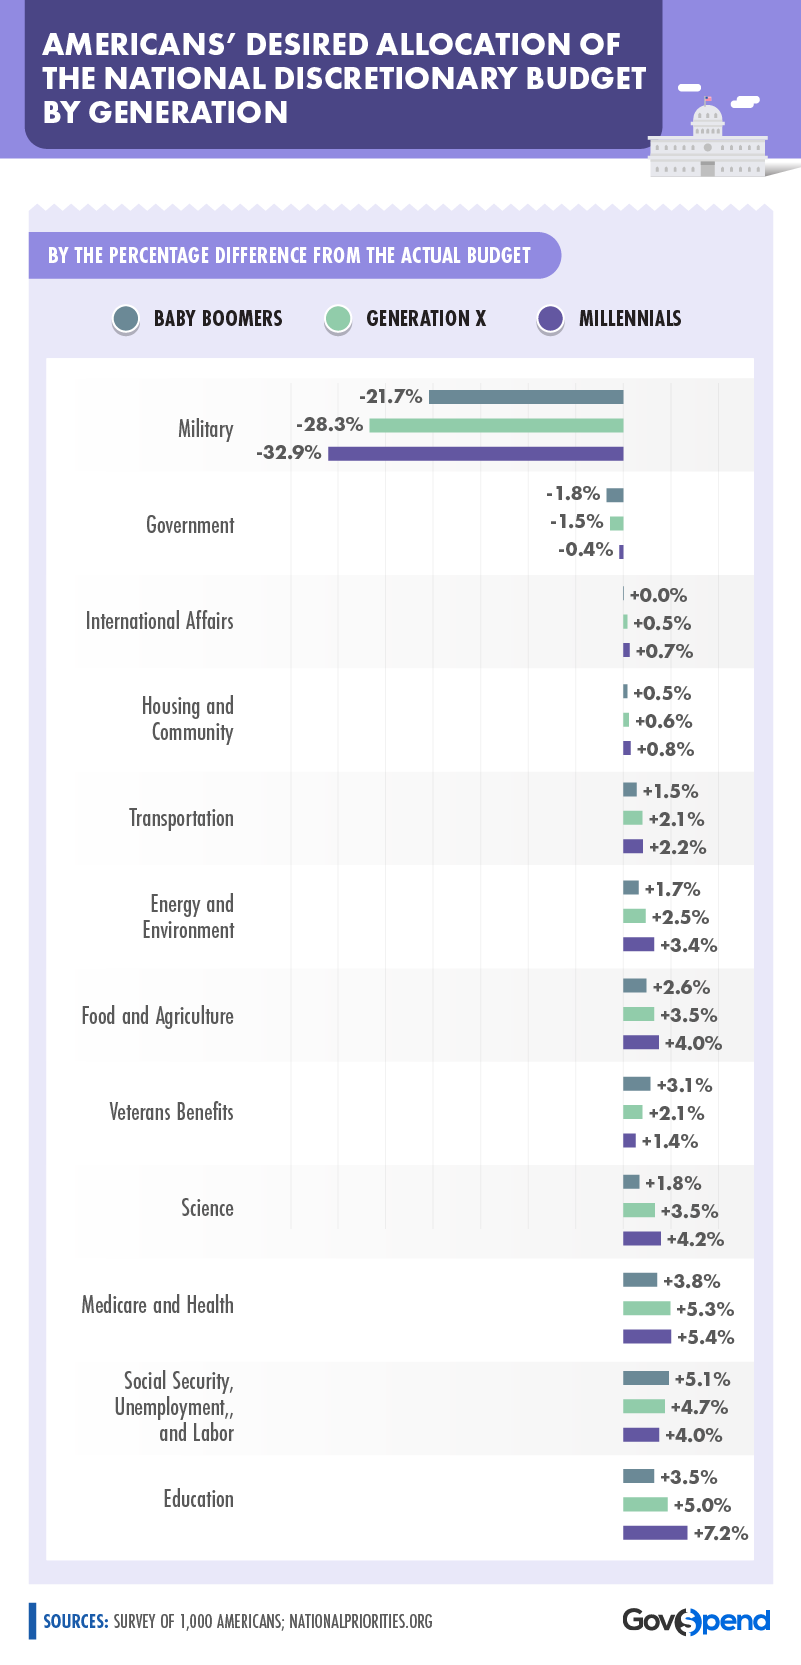
Today, the U.S. is more politically divided than ever before. Studies have shown the political gap could be more related to the generational divide than one might expect. While younger generations (including millennials and Gen Xers) tend to lean either completely liberal or at least slightly to the left, older Americans, including baby boomers, are more likely to identify as conservatives or Republicans.
Millennials indicated budget allocation for military spending should get the biggest cut – nearly 33 percent compared to just over 28 percent for Gen Xers and nearly 22 percent for baby boomers.
According to our poll, the top spending priority was different for each generation. According to millennials, education deserved the biggest increase (over 7 percent). Research suggests education and careers may be more important to today’s millennials than getting married or even having children. While Gen Xers wanted to see the largest adjustments applied to Medicare and health spending, baby boomers wanted Social Security spending to increase by over 5 percent.
Regional Responsibilities
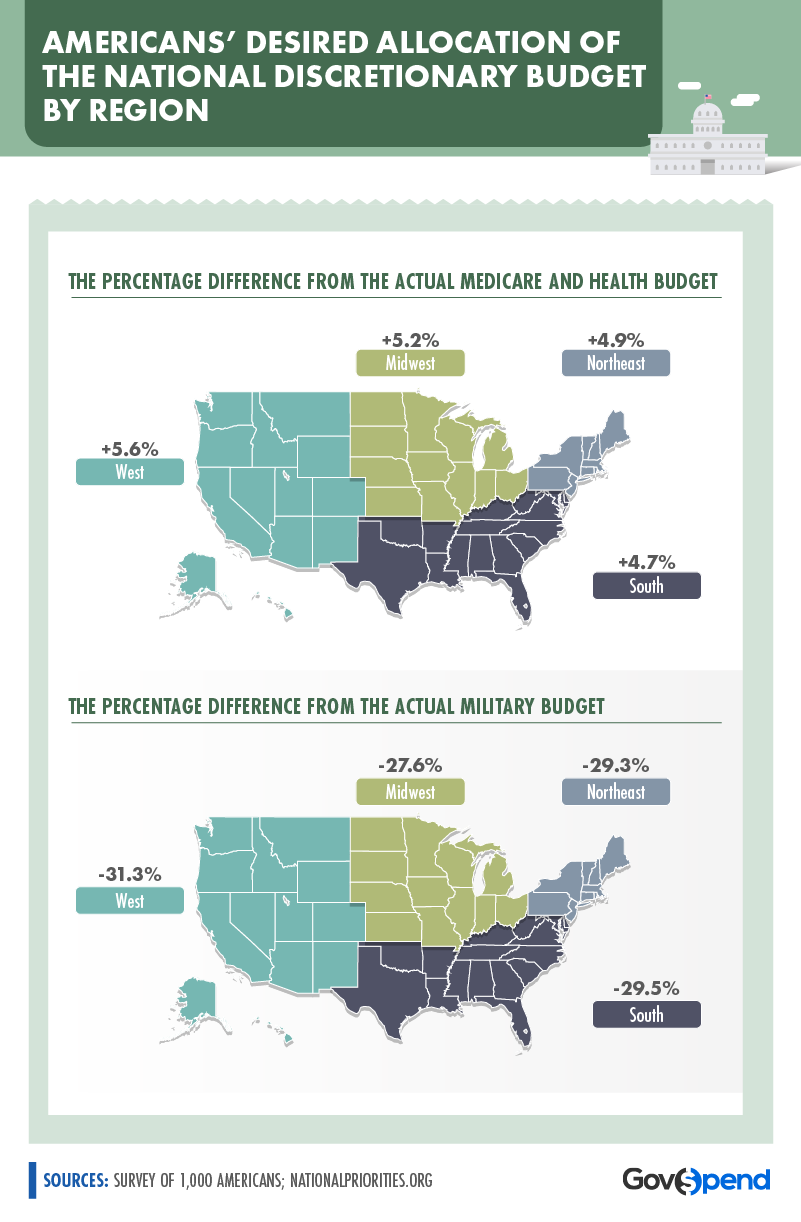
More Americans today believe the U.S. government is responsible for ensuring health care for every citizen. At 60 percent for universal coverage, more people now support the idea of government-funded health care than at any point in the last decade.
According to our survey, Americans living in Western states including California, Nevada, Idaho, and Oregon supported the biggest increase in the U.S. discretionary spending toward Medicare and health at 5.6 percent. Even in the South where support for increased spending on these services was lowest, people suggested a 4.7 percent increase, on average, was still appropriate.
While Americans living in the West wanted the deepest cuts to discretionary military spending, defense spending in California costs over $49 billion alone. With the second highest defense spending in the country, state officials are more interested in acquiring added defense contracts and increasing California’s military presence. Based on our poll, Americans living in the Midwest wanted the smallest change in discretionary military spending but still wanted a nearly 28 percent reduction.
Minds on the Money
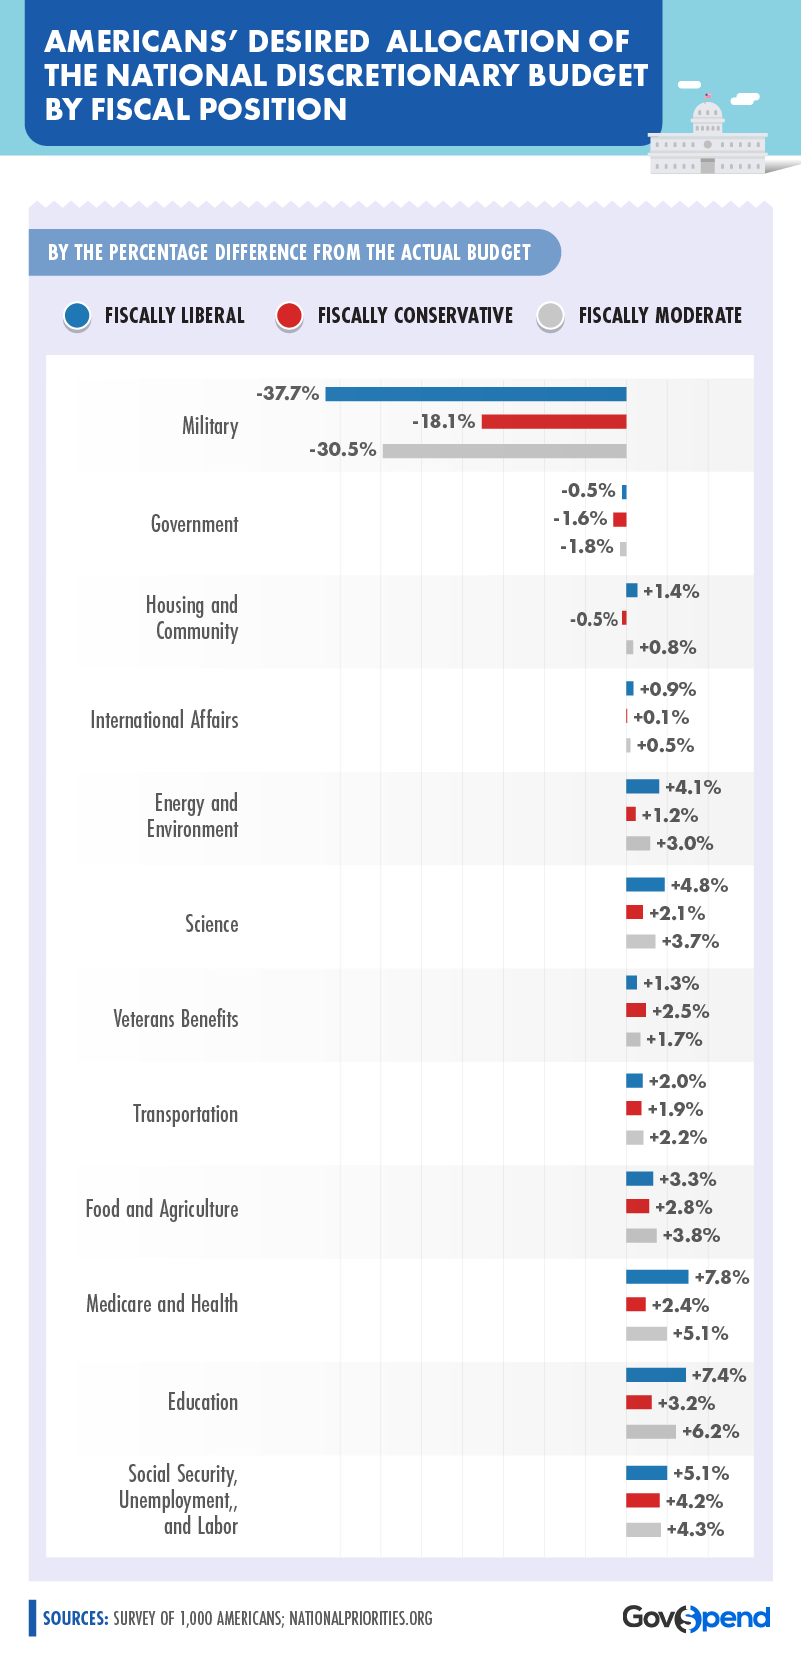
Americans with varying fiscal perspectives had different opinions on the ways budget spending should change in the U.S. While those who identified as fiscally moderate and liberal wanted to see cuts to military spending from anywhere between 30 to nearly 38 percent, fiscally conservative Americans wanted to see discretionary defense spending reduced by just over 18 percent.
As the future of tax credits for mortgage interests and state property taxes remain in limbo, fiscal conservatives were the only Americans to want a reduction in housing and community spending, while liberals and moderates requested more. Fiscal conservatives generally wanted to increase spending the least, although they suggested the largest increase to veterans benefits and somewhat equal expansion to transportation compared to fiscally moderate and liberal Americans polled.
Planning for the Future
Budget cuts in the coming months and years under a new president may still be up for debate, but while the government decides which programs should get more or less funding, we found not everyone agreed with this approach. According to our survey, most Americans – regardless of age or political affiliation – believed a majority of programs in the mandatory and discretionary budgets should get more money. Except for military spending (which could be getting a big boost shortly), Americans wanted to see spending on education, transportation, and veterans benefits roughly double.
At GovSpend, our mission is to help agencies make the best purchasing decisions and help vendors find the best government contracts by providing the most comprehensive and high-quality government spending data. Whether you’re a business looking for government connections or a government agency in search of new vendors, GovSpend is here to help. Visit us at GovSpend.com to learn more.
Methodology
We surveyed 1,000 Americans about how they thought federal mandatory and discretionary funds were allocated using percentages. We then showed them actual allocations from Nationalpriorities.org and asked them how they would allocate the budgets if they were in charge. Results were weighted by gender and age.
Sources
- https://www.nationalpriorities.org/budget-basics/federal-budget-101/spending/
- https://www.thebalance.com/who-owns-the-u-s-national-debt-3306124
- https://www.worldometers.info/world-population/us-population/
- https://www.newamerica.org/education-policy/policy-explainers/federal-education-budget/federal-budget-process/mandatory-and-discretionary-spending/
- https://www.thebalance.com/current-federal-mandatory-spending-3305772
- https://www.thebalance.com/current-us-discretionary-federal-budget-and-spending-3306308
- https://www.washingtonpost.com/news/the-fix/wp/2017/07/18/most-americans-worry-about-full-scale-war-with-north-korea-but-lack-confidence-in-trump-to-handle-issue/?utm_term=.551740bcebc9
- https://www.forbes.com/sites/niallmccarthy/2017/04/24/the-top-15-countries-for-military-expenditure-in-2016-infographic/#1b5a586243f3
- https://www.people-press.org/2017/04/24/with-budget-debate-looming-growing-share-of-public-prefers-bigger-government/
- https://www.businessinsider.com/how-the-us-military-spends-its-billions-2015-8
- https://www.politico.com/story/2017/10/05/poll-americans-divided-party-lines-243466
- https://www.pewresearch.org/fact-tank/2017/03/20/a-wider-partisan-and-ideological-gap-between-younger-older-generations/
- https://time.com/4748357/milennials-values-census-report/
- https://www.pewresearch.org/fact-tank/2017/01/13/more-americans-say-government-should-ensure-health-care-coverage/
- https://www.ncsl.org/research/military-and-veterans-affairs/military-s-impact-on-state-economies.aspx
- https://www.sandiegouniontribune.com/military/sd-me-military-hubs-20161107-story.html
- https://www.curbed.com/2017/10/30/16571964/trump-tax-reform-home-builders
- https://www.nytimes.com/2017/02/27/us/politics/trump-budget-military.html
Fair Use Statement
Are you planning to allocate our findings to your readers for noncommercial purposes? Simply link them back to this page, so our authors receive credit for their work.