March is Women’s History Month, a time to honor the incredible achievements of women. I was curious as to how this celebration came about and was surprised to read that the observance has its roots in Santa Rosa, California, where in 1978 the Education Task Force of the Sonoma County Commission on the Status of Women initiated a “Women’s History Week” celebration.
The local celebration’s success led to national interest in recognizing women’s historical contributions. In 1980, President Carter declared the week of March 8 as National Women’s History Week, highlighting women’s overlooked achievements. In 1987, Congress designated March as Women’s History Month, and since 1995, presidents have annually proclaimed March as Women’s History Month to honor women’s contributions to the U.S. across various fields.
In federal contracting, there are specific programs to support women-owned small businesses (WOSB) and meet the government’s goal of awarding 5% of total federal contracting dollars to WOSBs. So, how is the federal government performing in terms of awarding contracts to WOSBs?
In Fiscal Year (FY) 2024, federal contracts totaling $26.64 billion were awarded to 13,957 companies, an increase of $1.15B over FY 23. We also saw an increase in the number of companies in FY 24 from 13,707 companies in FY 23. WOSB awards accounted for 3.44% of the total federal contract awards, much below the 5% goal that the federal government wants to achieve.
| FY 2021 | FY 2022 | FY 2023 | FY 2024 | |
| Total Federal Contracts | $661,681,166,740 | $706,660,351,205 | $777,006,835,704 | $774,715,742,766 |
| Contract Awards to WOSB | $20,723,315,532 | $22,762,086,821 | $25,626,997,465 | $26,644,748,713 |
| % of Total Contracts Awarded to WOSB | 3.13% | 3.22% | 3.30% | 3.44% |
When examining the trends over the past four years, it is apparent that the federal government often finds it challenging to achieve its goals for women-owned small businesses overall.
Set-Aside Programs
It is important to further delve into how the contracts were awarded to WOSBs, specifically, in the use of set-aside programs. It is disappointing to see the lack of use of the WOSB set-aside programs, which accounted for less than $1.3B of the total awards to WOSBs. This is less than 0.3% of the total contract awards of $774B.
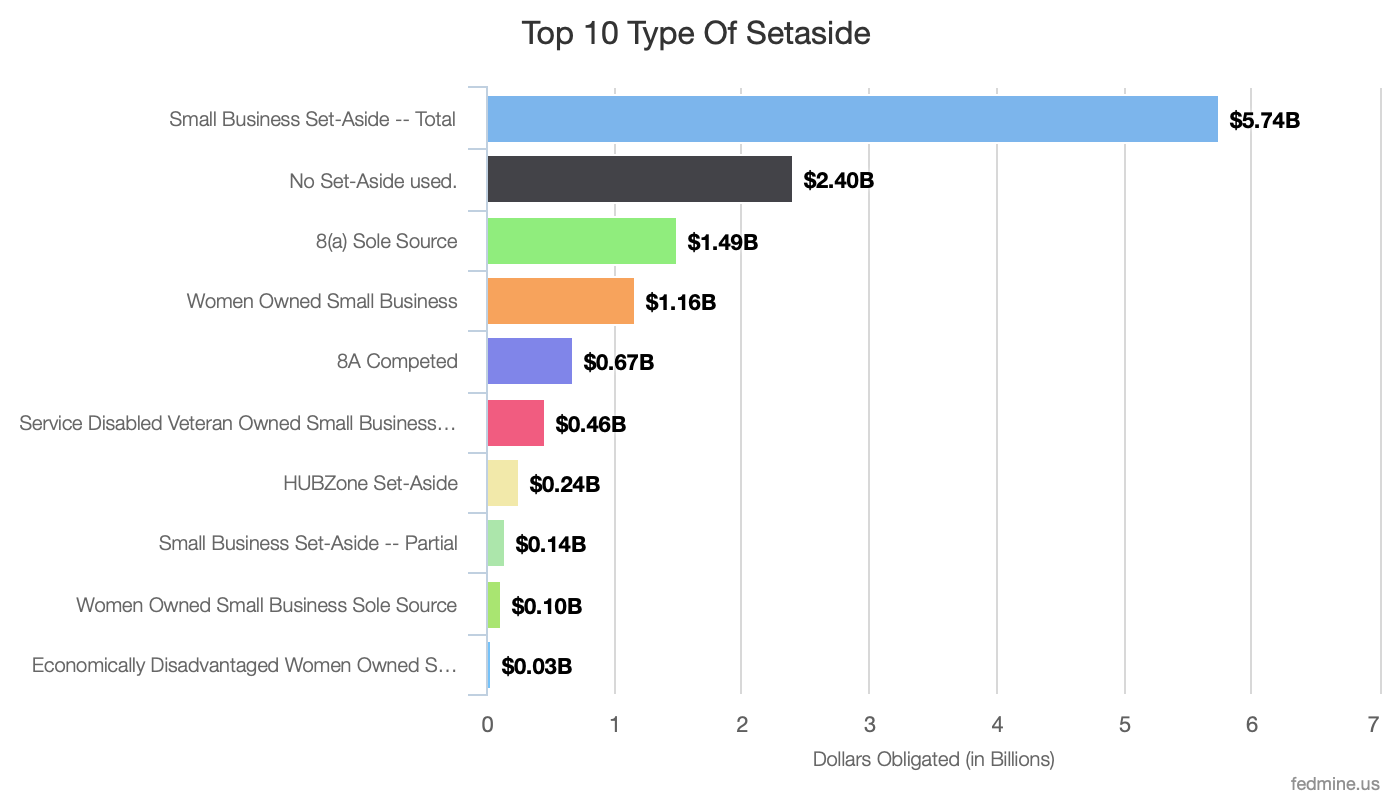
In terms of set-aside programs used to award contracts to WOSBs, we see that small business set-asides continue to lead with almost $6B (21.5%) in awards, followed by 8(a) sole source and 8(a) competed awards with $2.16B (8.1%) in awards to WOSBs. WOSB set-aside awards accounted for $1.3B, amounting to less than 5% of the awards to WOSBs.
Agency Analysis
While analyzing agency spending, we must focus not only on the overall agency expenditure but also internal trends within that agency.
Defense agencies such as the Army, Navy, and Air Force were in the top 15 agencies and accounted for $12.7B of the total awards to women-owned businesses. Health & Human Services, Homeland Security, USDA, GSA, and the Dept of Veterans Affairs were all part of the top 15 agencies. If we look at the percentage increase in dollars awarded in FY 24 compared to FY 23, we get a better idea of how each agency performed in regards to working with women-owned businesses. The Air Force, HHS, DHS, DLA, USDA, VA, and NASA all saw more than 5% increases in awards to WOSBs!
| Agency | FY 2021 | FY 2022 | FY 2023 | FY 2024 | % Increase – FY 24 over FY 23 |
| 2100 – ARMY | $3,303,621,864 | $3,774,704,950 | $3,808,100,353 | $3,886,243,837 | 2.05% |
| 1700 – NAVY, DEPARTMENT OF | $2,500,792,689 | $2,527,741,049 | $2,867,265,174 | $2,874,263,085 | 0.24% |
| 5700 – AIR FORCE | $1,913,438,192 | $2,275,534,084 | $2,419,742,747 | $2,628,196,791 | 8.61% |
| 7500 – HEALTH AND HUMAN SERVICES | $1,769,409,189 | $1,441,459,461 | $1,935,075,808 | $2,055,399,526 | 6.22% |
| 7000 – HOMELAND SECURITY | $1,176,089,464 | $1,566,527,264 | $1,704,440,683 | $1,887,010,695 | 10.71% |
| 97AS – DEFENSE LOGISTICS AGENCY (DLA) | $1,309,988,715 | $1,406,826,239 | $1,451,228,793 | $1,724,799,060 | 18.85% |
| 9700 – DEFENSE, DEPARTMENT OF | $1,250,133,754 | $1,456,034,218 | $1,847,945,621 | $1,602,041,895 | -13.31% |
| 1200 – AGRICULTURE, DEPARTMENT OF | $693,191,580 | $827,922,270 | $1,164,283,123 | $1,240,210,169 | 6.52% |
| 4700 – GENERAL SERVICES ADMINISTRATION | $969,338,467 | $1,117,896,542 | $1,231,415,894 | $1,205,923,252 | -2.07% |
| 3600 – DEPARTMENT OF VETERANS AFFAIRS | $642,968,128 | $906,150,000 | $888,034,279 | $984,999,697 | 10.92% |
| 2000 – TREASURY, DEPARTMENT OF | $528,615,731 | $515,824,531 | $865,904,001 | $830,641,823 | -4.07% |
| 8000 – NATIONAL AERONAUTICS AND SPACE ADMINISTRATION | $643,834,425 | $674,301,582 | $711,368,877 | $804,703,013 | 13.12% |
| 1400 – INTERIOR, DEPARTMENT OF | $522,581,845 | $648,085,999 | $647,392,751 | $698,043,700 | 7.82% |
| 1300 – COMMERCE, DEPARTMENT OF | $460,725,320 | $547,771,691 | $669,213,585 | $687,874,885 | 2.79% |
| 6900 – TRANSPORTATION | $466,650,377 | $546,859,338 | $565,420,947 | $563,826,005 | -0.28% |
Typically the mission of the agency determines the types of products and services they acquire, hence some agencies can procure more from small and women-owned businesses.
Analyzing the top federal agencies that allocated contracts to WOSBs and comparing these allocations to the total awards at each agency allows us to get a more comprehensive understanding of an agency’s contracting practices with WOSBs. Unsurprisingly, while 48% of the total awards to WOSBs were awarded by the Defense agencies, WOSB awards account for less than 3% of the total DoD spend of $455.2B (DoD agencies include contracts awarded by Army, Navy, Air Force, Dept of Defense, and DLA.)
| Agency | FY 2024 – Contracts to WOSBs | FY 2024 – Total Federal Contracts | % of Contracts Awarded to WOSBs |
| 2100 – ARMY | $3,886,243,837 | $102,480,692,513 | 3.79% |
| 1700 – NAVY, DEPARTMENT OF | $2,874,263,085 | $137,481,729,932 | 2.09% |
| 5700 – AIR FORCE | $2,628,196,791 | $105,204,130,755 | 2.50% |
| 7500 – HEALTH AND HUMAN SERVICES | $2,055,399,526 | $36,761,504,789 | 5.59% |
| 7000 – HOMELAND SECURITY | $1,887,010,695 | $23,627,336,854 | 7.99% |
| 97AS – DEFENSE LOGISTICS AGENCY (DLA) | $1,724,799,060 | $52,988,516,923 | 3.26% |
| 9700 – DEFENSE, DEPARTMENT OF | $1,602,041,895 | $57,056,987,179 | 2.81% |
| 1200 – AGRICULTURE, DEPARTMENT OF | $1,240,210,169 | $11,576,339,947 | 10.71% |
| 4700 – GENERAL SERVICES ADMINISTRATION | $1,205,923,252 | $26,939,027,227 | 4.48% |
| 3600 – DEPARTMENT OF VETERANS AFFAIRS | $984,999,697 | $66,933,550,158 | 1.47% |
| 2000 – TREASURY, DEPARTMENT OF | $830,641,823 | $9,257,717,244 | 8.97% |
| 8000 – NATIONAL AERONAUTICS AND SPACE ADMINISTRATION | $804,703,013 | $21,243,401,954 | 3.79% |
| 1400 – INTERIOR, DEPARTMENT OF | $698,043,700 | $8,330,360,505 | 8.38% |
| 1300 – COMMERCE, DEPARTMENT OF | $687,874,885 | $5,187,369,442 | 13.26% |
| 6900 – TRANSPORTATION | $563,826,005 | $9,283,115,135 | 6.07% |
It was heartening to see many agencies such as Homeland Security, USDA, HHS, Treasury, DOI, Commerce, and DoT exceed the goal of 5% of their total contract awards going to WOSBs.
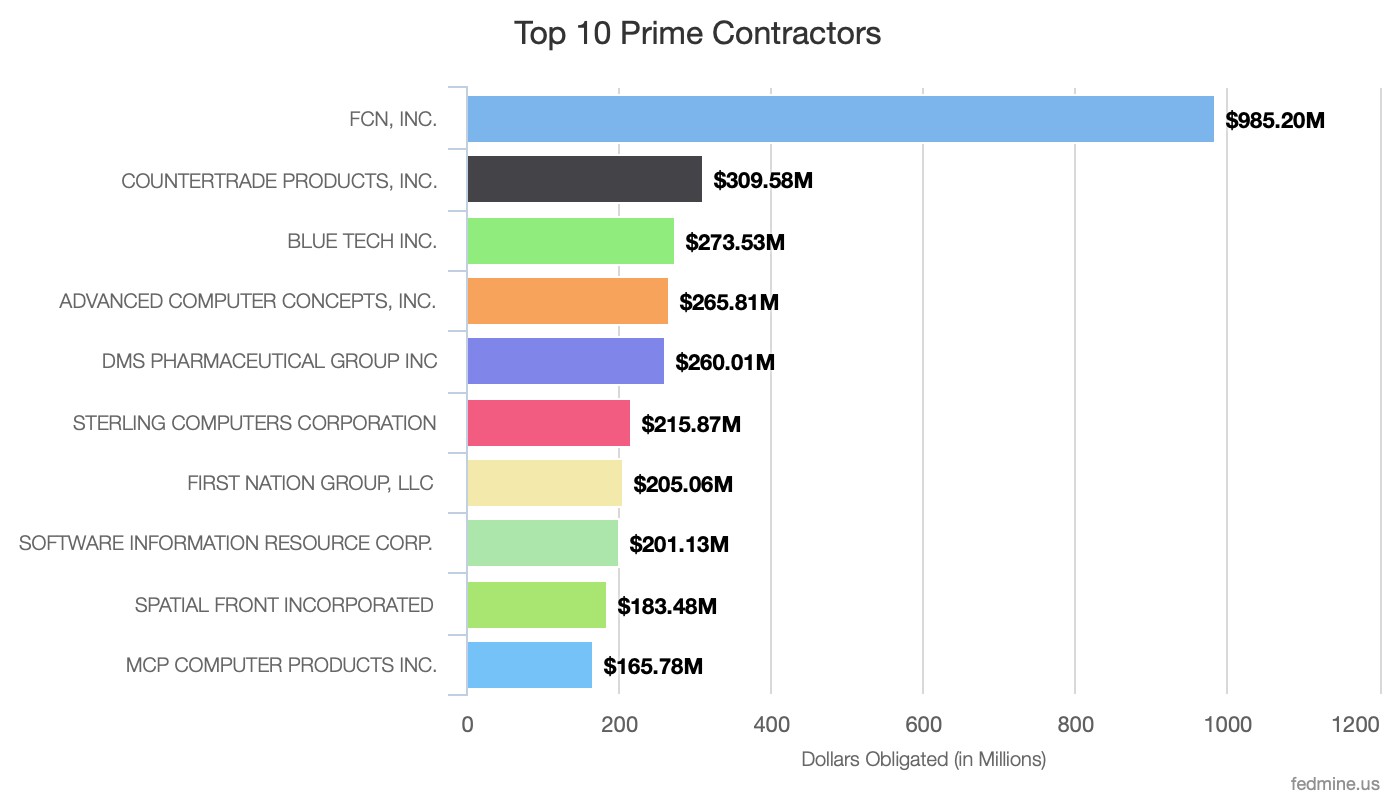
Top Companies
The top companies include FCN, Countertrade Products, and Blue Tech Inc. Interestingly, 8 of the top 10 companies are in the IT Category, while DMS Pharmaceuticals Group and First Nation Group are in the Medical Category.
Industry Analysis
It is no surprise to see that 54% of the awards were in the Professional Services & IT categories, followed by Facilities & Construction at 19%. Medical follows a distant fourth at less than 5%.
| Category Spend – FY 24 | Total | % |
| Professional Services | $7,653,583,068 | 28.72% |
| IT | $6,740,187,649 | 25.29% |
| Facilities & Construction | $5,054,244,175 | 18.97% |
| Medical | $1,220,058,432 | 4.58% |
| Research and Development | $833,899,024 | 3.13% |
| Industrial Products & Services | $739,777,612 | 2.78% |
| Human Capital | $652,612,671 | 2.45% |
| Transportation and Logistics Services | $606,962,713 | 2.28% |
| Clothing, Textiles & Subsistence S&E | $558,853,802 | 2.10% |
| Electronic & Communication Equipment | $482,372,896 | 1.81% |
| Security and Protection | $460,347,060 | 1.73% |
| Sustainment S&E | $459,600,930 | 1.72% |
| Weapons & Ammunition | $367,794,402 | 1.38% |
| Equipment Related Services | $330,389,699 | 1.24% |
| Office Management | $258,401,314 | 0.97% |
| Travel & Lodging | $146,172,854 | 0.55% |
| Electronic & Communication Services | $30,932,431 | 0.12% |
| Aircraft, Ships/Submarines & Land Vehicles | $27,428,581 | 0.10% |
| Miscellaneous S&E | $24,805,315 | 0.09% |
| Total | $26,648,424,629 |
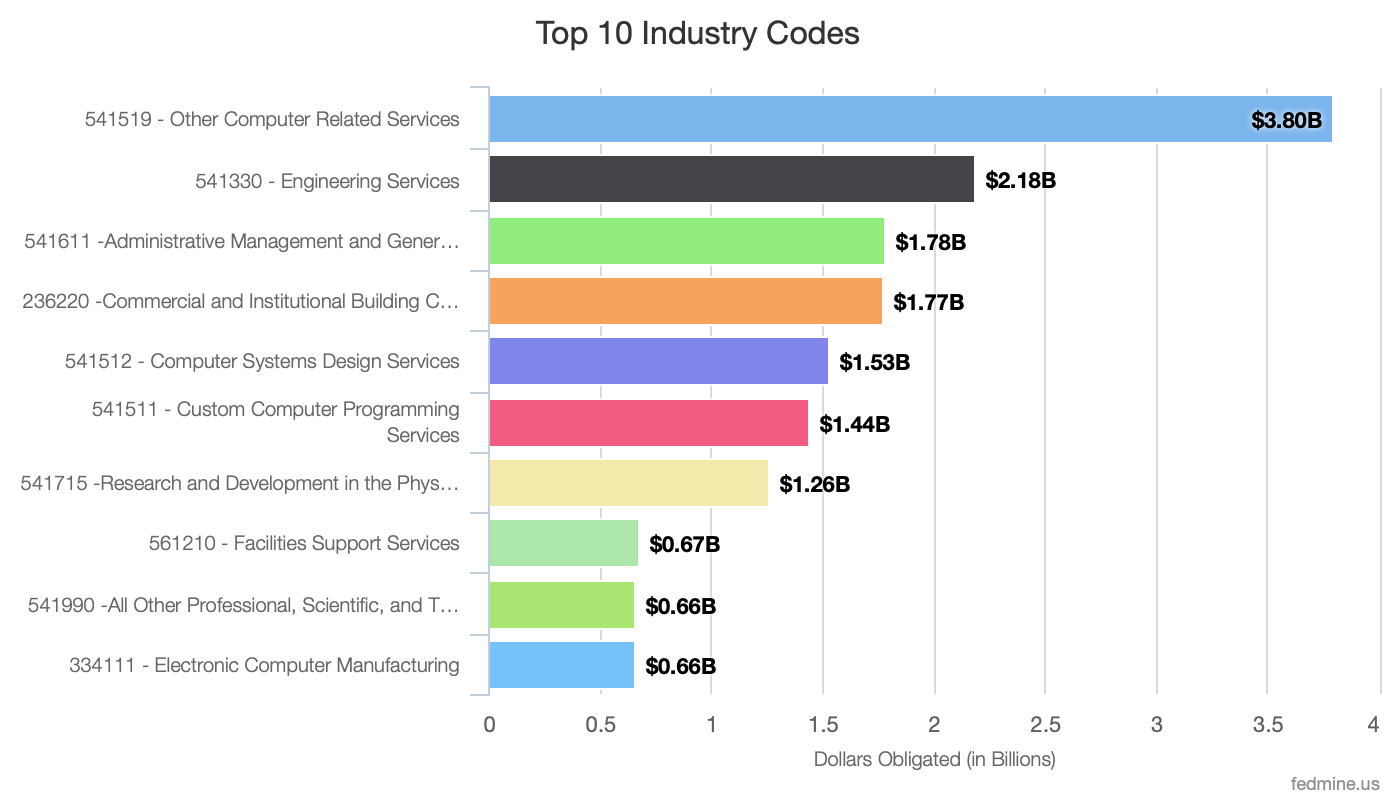
The NAICS codes under which the contracts were awarded are in line with the top categories, with computer-related services, engineering, and administrative management as the top 3 NAICS codes.
The US SBA maintains a list of industries that are eligible under the WOSB program. Of the 773 eligible industries, 626 are designated for limited competition for all WOSB programs and 107 are only eligible amongst the SBA-certified Economically Disadvantaged Women-Owned Small Business program. Perhaps it is time to expand this list? Or do away with the list of eligible industries for set-asides/sole source awards, to encourage the use of the WOSB/EDWOSB programs by making it simpler?
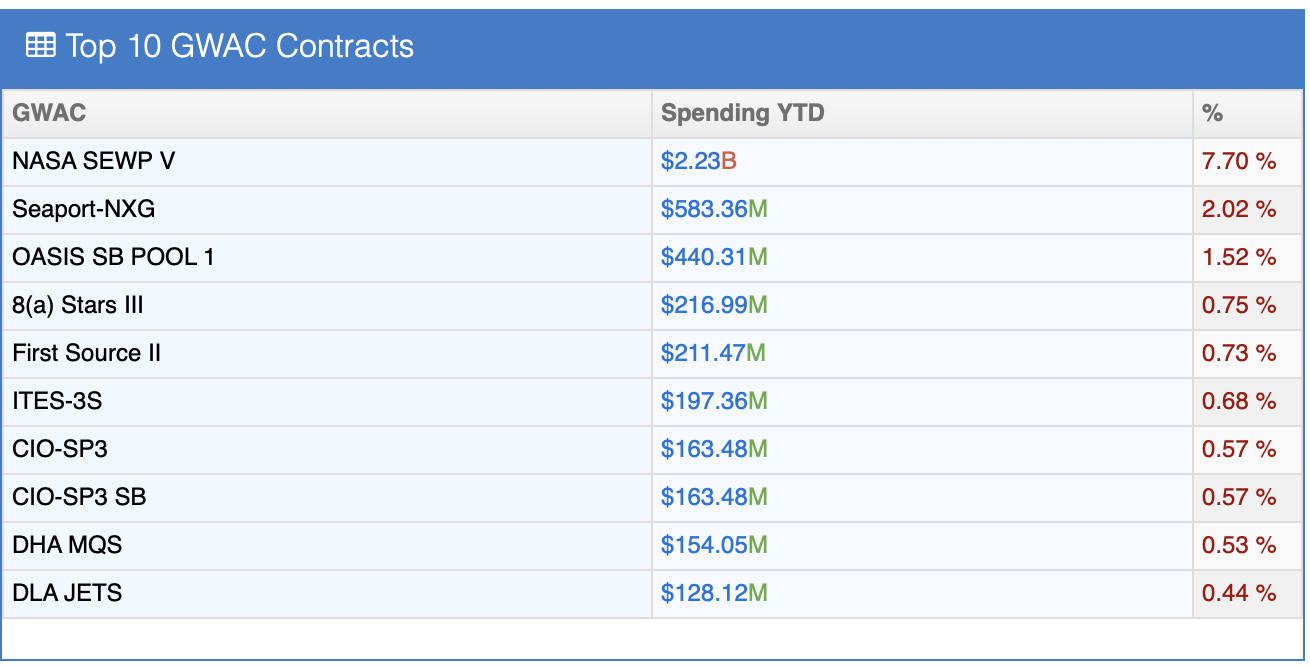
Use of GWACs/IDIQs/MAS
Given that the top companies are in the IT industry, it is no surprise that NASA SEWP V was the top vehicle, followed by Seaport NXG. The top 10 GWACs account for $2.26B (8.5%) of the total awards to WOSBs.
In addition to the use of GWACs, the MAS GSA Schedule accounted for $2.5B in awards across 2,894 companies. It is important for a WOSB to evaluate the use of these vehicles within their industry, given the use of these vehicles by the federal government.
While progress has been made in increasing contract awards to Women-Owned Small Businesses, it is disheartening to see that the awards languish in the 3-4% range and agencies are unable to meet the 5% goal. The data indicates the limited use of WOSB set-aside programs and the concentration of awards within specific industries and agencies. Updates in the FAR require companies to be certified to be eligible to win set-aside and sole source awards. In addition, the updates clarify control of a WOSB/EDWOSB. Encouraging broader participation through expanded industry eligibility, simplified certification processes, and increased agency accountability could help bridge this gap.
Additionally, WOSBs need to look at leveraging government-wide acquisition contracts (GWACs), multiple award schedules (MAS), and set-aside programs more effectively. Use of prime/subprime relationships, teaming, and joint ventures are all strategies that can create greater opportunities for WOSBs.
As we celebrate Women’s History Month, it’s essential to move beyond recognition and work toward meaningful change that helps our agencies and policymakers turn that 5% goal into a reality.