
Established in 1963 by President John F Kennedy to honor the contributions of the American entrepreneurs, the National Small Business Week is observed annually to celebrate the contributions of our small businesses. For over 50 years, the National Small Business Week has been administered by the U.S. Small Business Administration (SBA) during the first week of May.
The US Census Bureau, based on its FY23 study, reported that the total number of businesses increased from 5.53 million in FY22 to 5.58 million in FY23. In addition to these businesses that had at least one paid employee, the number of non-employer establishments also grew from 29.8 million in FY22 to 30.4million establishments in FY23.
So how did these small businesses do in the federal contracting arena in FY25?
While the data shows an increase in small businesses and a growth in federal spending in FY25, this does not automatically translate into growth for small businesses in the federal contracting space.
In FY25, $172.6B was awarded to 76,509 businesses – a decline of $4B from FY24 when $176.6B was awarded to 78,753 businesses. The decline is notable because FY23 and FY24 both showed growth in small business awards. In FY23, small business awards increased by approximately $16.9B, or 10.9%, followed by a more modest $4B increase in FY24. FY25 breaks that pattern: even though total federal spending increased and reached $813B in FY25, small business participation declined both in actual dollars and as a percentage of overall federal spending.
| Fiscal Year | FY22 | FY 23 | FY24 | FY25 |
| Total Federal Contract Awards | $706.7B | $777.0B | $775.8B | $812.8B |
| Small Business Awards | $155.6B | $172.5B | $176.6B | $172.6B |
Agency Analysis – Defense Continues to Dominate
In terms of top agencies, it is no surprise to see the defense agencies, including the Department of the Army, Defense Logistics Agency (DLA), the Navy, and the Air Force, are the top agencies in terms of contract values. In fact, the defense agencies account for 58% or $100.4B of the total awards to small businesses.
|
Contracts awarded to Small Businesses – Top 15 Contracting Agency |
||||
| Agency | FY 2022 | FY 2023 | FY 2024 | FY 2025 |
| 2100 – ARMY | $25,384,261,385 | $25,980,460,545 | $25,910,629,354 | $25,899,514,423 |
| 97AS – DEFENSE LOGISTICS AGENCY (DLA) | $16,155,313,052 | $18,781,919,591 | $20,635,464,330 | $23,633,848,755 |
| 1700 – NAVY, DEPARTMENT OF | $18,727,880,043 | $20,949,850,961 | $21,925,428,707 | $21,665,357,512 |
| 5700 – AIR FORCE | $15,658,812,357 | $17,010,773,416 | $18,529,612,541 | $19,074,501,071 |
| 3600 – DEPARTMENT OF VETERANS AFFAIRS | $11,116,257,650 | $12,516,051,711 | $12,085,859,028 | $12,208,963,694 |
| 9700 – DEFENSE, DEPARTMENT OF | $8,543,915,999 | $9,650,073,979 | $9,926,370,801 | $10,197,647,403 |
| 7000 – HOMELAND SECURITY | $8,681,463,943 | $9,590,215,831 | $9,473,831,664 | $9,537,592,226 |
| 1200 – AGRICULTURE, DEPARTMENT OF | $6,500,187,670 | $8,079,431,308 | $8,526,963,801 | $7,128,140,123 |
| 7500 – HEALTH AND HUMAN SERVICES | $8,990,073,748 | $9,732,177,129 | $8,767,031,092 | $7,108,564,846 |
| 4700 – GENERAL SERVICES ADMINISTRATION | $6,021,950,985 | $6,756,319,173 | $7,024,004,494 | $6,264,768,731 |
| 8000 – NATIONAL AERONAUTICS AND SPACE ADMINISTRATION | $3,581,168,277 | $3,688,135,718 | $3,624,559,091 | $3,939,269,196 |
| 1400 – INTERIOR, DEPARTMENT OF | $3,439,379,490 | $4,124,172,360 | $4,195,613,520 | $3,495,570,965 |
| 1900 – STATE, DEPARTMENT OF | $3,225,858,381 | $3,545,911,236 | $4,316,306,376 | $3,419,632,959 |
| 6900 – TRANSPORTATION | $2,947,192,136 | $3,394,223,274 | $3,281,691,584 | $3,298,959,671 |
| 2000 – TREASURY, DEPARTMENT OF | $3,490,566,209 | $3,692,947,409 | $3,672,343,490 | $3,249,733,881 |
| GRAND TOTAL | $155,614,521,851 | $172,536,220,031 | $176,584,789,227 | $172,610,103,710 |
More than 42 agencies saw reductions in awards to small businesses, totalling $8.4B. The Department of Health and Human Services and the Department of Agriculture saw the largest decreases of $1.65B and $1.39B, respectively. The Department of State, GSA, and Department of the Interior all saw declines in FY25.
| Agency | FY 2024 | FY 2025 | Increase/Decrease |
| 7500 – HEALTH AND HUMAN SERVICES | $8,767,031,092 | $7,108,564,846 | ($1,658,466,246) |
| 1200 – AGRICULTURE, DEPARTMENT OF | $8,526,963,801 | $7,128,140,123 | ($1,398,823,677) |
| 1900 – STATE, DEPARTMENT OF | $4,316,306,376 | $3,419,632,959 | ($896,673,417) |
| 4700 – GENERAL SERVICES ADMINISTRATION | $7,024,004,494 | $6,264,768,731 | ($759,235,764) |
| 1400 – INTERIOR, DEPARTMENT OF | $4,195,613,520 | $3,495,570,965 | ($700,042,555) |
| 7200 – AGENCY FOR INTERNATIONAL DEVELOPMENT | $984,148,880 | $398,582,855 | ($585,566,025) |
| 2000 – TREASURY, DEPARTMENT OF | $3,672,343,490 | $3,249,733,881 | ($422,609,609) |
| 1300 – COMMERCE, DEPARTMENT OF | $2,540,340,284 | $2,195,267,143 | ($345,073,141) |
| 1700 – NAVY, DEPARTMENT OF | $21,925,428,707 | $21,665,357,512 | ($260,071,195) |
| 1600 – LABOR, DEPARTMENT OF | $1,002,150,709 | $785,205,200 | ($216,945,510) |
Among the major agencies, DLA recorded the largest increase in obligations to small businesses, growing by nearly $3B, or 15%, over FY24. The Department of the Air Force, NASA, and the Department of Veterans Affairs also recorded increases in obligations.
| Agency | FY 2024 | FY 2025 | Increase/Decrease |
| 97AS – DEFENSE LOGISTICS AGENCY (DLA) | $20,635,464,330 | $23,633,848,755 | $2,998,384,425 |
| 5700 – AIR FORCE | $18,529,612,541 | $19,074,501,071 | $544,888,529 |
| 8000 – NATIONAL AERONAUTICS AND SPACE ADMINISTRATION | $3,624,559,091 | $3,939,269,196 | $314,710,105 |
| 9700 – DEFENSE, DEPARTMENT OF | $9,926,370,801 | $10,197,647,403 | $271,276,602 |
| 3600 – DEPARTMENT OF VETERANS AFFAIRS | $12,085,859,028 | $12,208,963,694 | $123,104,666 |
| 8900 – ENERGY, DEPARTMENT OF | $2,355,118,599 | $2,420,091,669 | $64,973,070 |
| 7000 – HOMELAND SECURITY | $9,473,831,664 | $9,537,592,226 | $63,760,563 |
| 3300 – SMITHSONIAN INSTITUTION | $166,386,575 | $186,152,259 | $19,765,684 |
| 6900 – TRANSPORTATION | $3,281,691,584 | $3,298,959,671 | $17,268,087 |
| 8300 – Export-Import Bank of the U.S. | $27,908,050 | $38,756,138 | $10,848,088 |
A total of 27 agencies saw an increase in awards to small businesses, totalling $4.5B. For newer entrants and smaller firms, the challenge is no longer simply qualifying as a small business — it is understanding where agencies are spending, how they are buying, and which acquisition strategies are being prioritized.
Percentage of Awards Matters:
Looking at total awards to small businesses alone only tells part of the story. Evaluating awards as a percentage of the total contract awards provides a better understanding of the agency’s procurement strategy and small business utilization.
While agencies such as the Army, Navy, and Air Force dominate in total contract dollars, agencies such as the Department of Agriculture (USDA), Environmental Protection Agency (EPA), Department of the Interior, and Department of Commerce awarded more than 50% of their contracts to small businesses.
DLA stands out as it has not only increased the actual dollars awarded to small businesses, but also the percentage of total awards among the major contracting agencies.
| Top 15 Agencies | FY 25 Awards | FY25 Awards to Small Business | % of Awards to Small Business |
| Army | $108.8B | $25.9B | 23.80% |
| Defense Logistics Agency (DLA) | $55.9B | $23.6B | 42.20% |
| Navy | $179.7B | $21.7B | 12.10% |
| Air Force | $103.4B | $19.1B | 18.50% |
| Veterans Affairs | $78.3B | $12.2B | 15.60% |
| Department of Defense | $57.6B | $10.2B | 17.70% |
| Homeland Security | $28.4B | $9.5B | 33.50% |
| Health & Human Services | $26.8B | $7.1B | 26.50% |
| Agriculture (USDA) | $9.6B | $7.1B | 74.00% |
| General Services Admin. | $24.3B | $6.3B | 25.90% |
| NASA | $22.8B | $3.9B | 17.10% |
| Interior | $6.9B | $3.5B | 50.70% |
| State Dept | $9.9B | $3.4B | 34.30% |
| Transportation | $9.9B | $3.3B | 33.30% |
| Treasury | $8.5B | $3.2B | 37.60% |
Understanding the agencies with strong small business utilization rates, specifically in a company’s industry, may provide accessible entry points as they grow in the federal market space.
Industry & NAICS trends
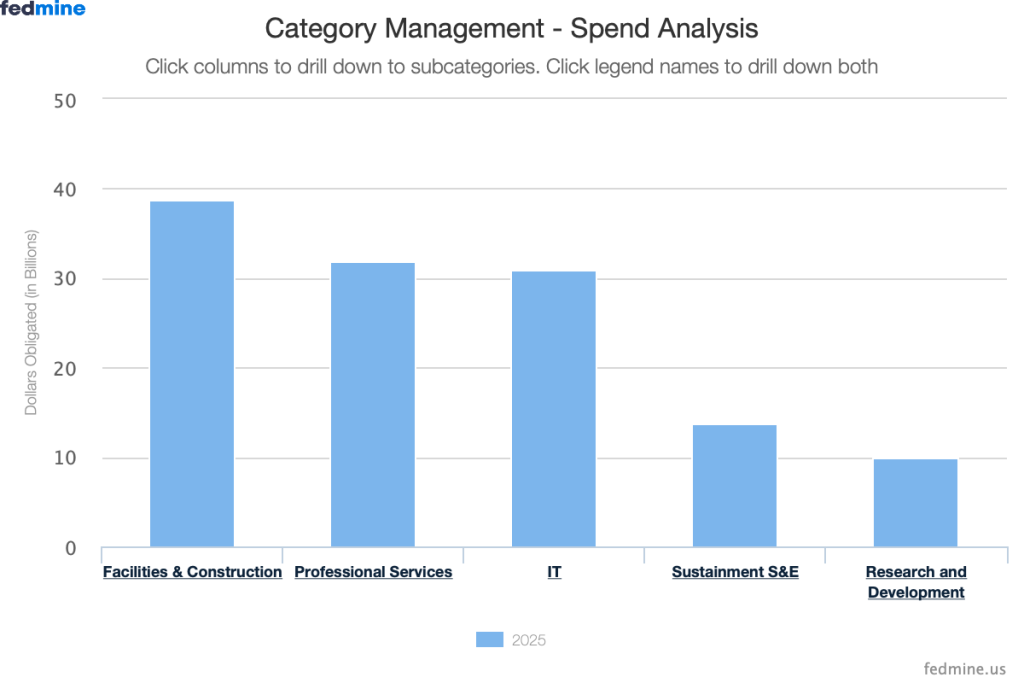
In terms of broad categories, Facilities & Construction, Professional Services, and Medical are the top three categories for overall industry spend. Facilities & Construction, Professional Services, IT, Sustainment S&E, and Research & Development remain the top five categories for small businesses.
The NAICS analysis also provides a clearer picture of where small businesses continue to compete effectively. NAICS codes such as:
- 541519 — Other Computer Related Services
- 236220 — Commercial & Institutional Building Construction
- 541511 — Custom Computer Programming Services
- 541611 — Administrative Management Consulting
continue to show strong small business participation rates.
| Top 15 NAICS | TOTAL FY2025 | SB AWARDS FY2025 | SB % |
| 541519 — Other Computer Related Services | $25.07B | $16.39B | 65.40% |
| 236220 — Commercial & Institutional Building Construction | $30.64B | $13.49B | 44.00% |
| 541330 — Engineering Services | $52.27B | $11.54B | 22.10% |
| 541715 — R&D in Physical, Engineering & Life Sciences | $48.41B | $11.16B | 23.10% |
| 541512 — Computer Systems Design Services | $32.04B | $7.54B | 23.50% |
| 561210 — Facilities Support Services | $38.26B | $5.62B | 14.70% |
| 541511 — Custom Computer Programming Services | $10.36B | $5.27B | 50.90% |
| 541611 — Administrative Management Consulting | $11.31B | $5.19B | 45.90% |
| 423850 — Service Establishment Equipment & Supplies Wholesale | $4.54B | $4.48B | 98.80% |
| 339999 — All Other Miscellaneous Manufacturing | $4.30B | $4.09B | 95.20% |
| 541712 — R&D in Physical, Engineering Sciences (Biotech) | $9.05B | $3.32B | 36.70% |
| 336413 — Other Aircraft Parts & Auxiliary Equipment Mfg | $19.77B | $3.13B | 15.80% |
| 620000 — Healthcare & Social Assistance (aggregate) | $16.40B | $2.80B | 17.10% |
| 336611 — Ship Building and Repairing | $37.18B | $2.60B | 7.00% |
| 562910 — Remediation Services | $6.99B | $2.55B | 36.50% |
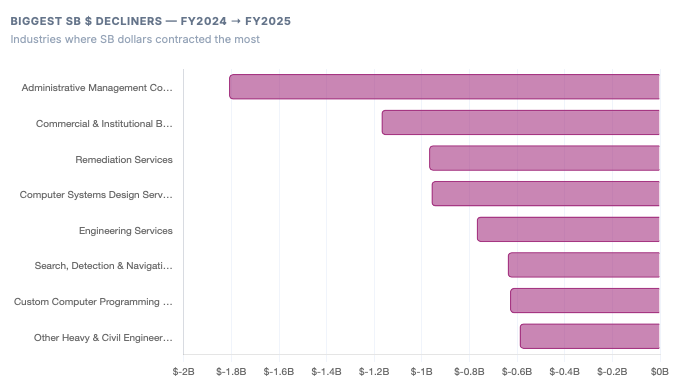
An analysis of the NAICS codes for FY24 and FY25 for awards to small businesses also provides changing procurement patterns. Industries such as Administrative Management Consulting, Construction, and Remediation Services experienced declines in FY25 obligations to small businesses.
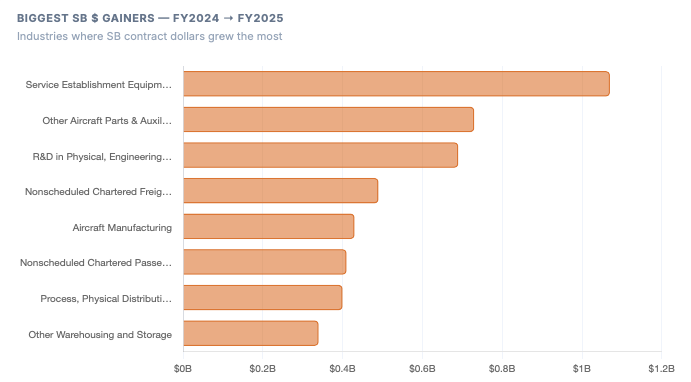
Largest dollar gains have also been observed in industries which include R&D, Aircraft manufacturing and non-scheduled chartered passenger air passenger (481211) and freight (481212)
The changing priorities of an administration and agencies are observed through the use of data, and it is important to follow as it affects a company’s business development and sales strategy.
Use of Set-Asides
The use of set-asides provides an insight into how agencies use the various set-aside processes to award these contracts. Of the $173B that was awarded to small businesses in FY25, less than 34% or $58.3B was awarded using set-asides.
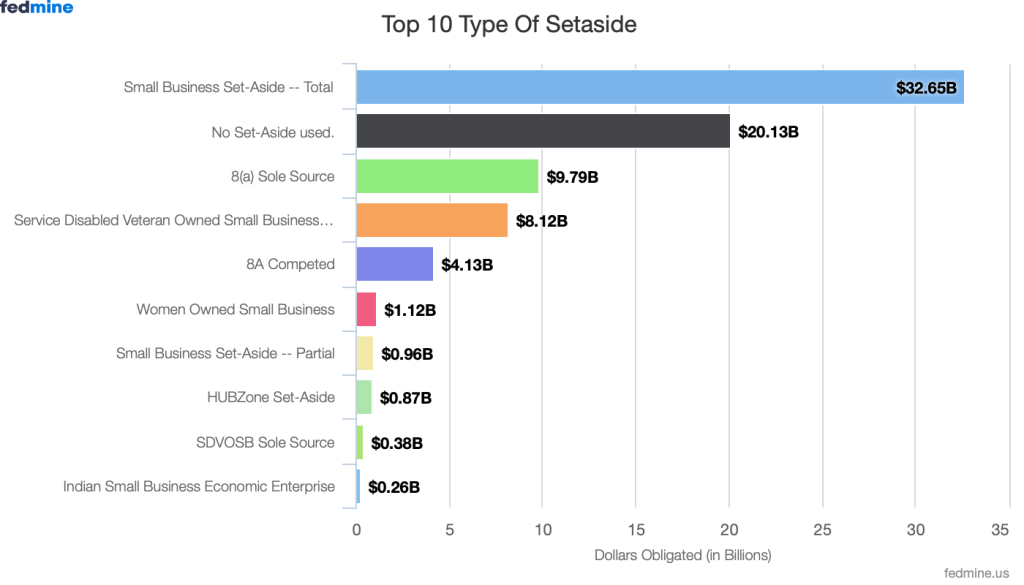
While the use of small business set-aside is most prevalent and accounts for 56% of all the set-asides, we also see the use of 8a sole source and set-asides, which account for less than $14B. SDVOSB set-asides and sole source awards account for less than $8.5B.
Use of GWACs & IDIQs
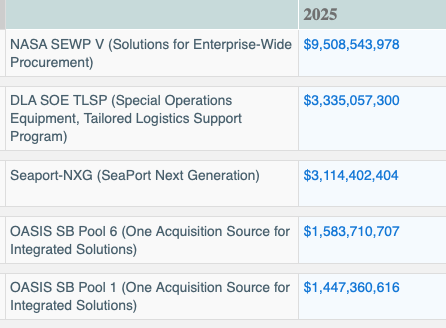
In FY25, a little more than $30B was awarded on the various GWACs and IDIQs, including the vehicles managed by the US GSA. NASA SEWP V continues to dominate and accounts for more than 31% of the awards on these GWACs/IDIQs
SBIRs/STTRs
$6.85B of the total awards were awarded as an SBIR or STTR across 3,325 companies, mainly in the R&D category.
Top Small Businesses
In FY25, the top small businesses are Atlantic Diving Supply, followed by WS Darley & Co and FCN Inc. The top ten companies also include Minburn Technology Group, Thundercat Technology, Four Points Technology, and V3Gate – all service disabled veteran owned (SDVOSB) businesses.
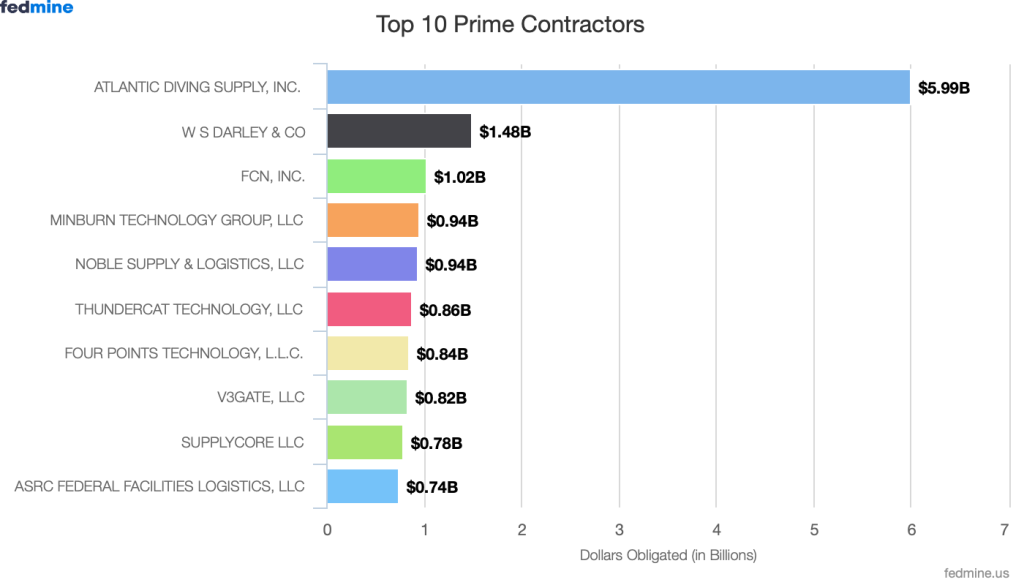
While Atlantic Diving Supply accounts for 3.4% of the total awards to small businesses, the top 10 companies account for 8% of the total awards to small businesses.
Outlook
FY 25 has been a year of change with the revolutionary FAR overhaul, executive orders, and DOGE, to name a few. FY26 is also turning out to be a challenging year, not only with the war in Iran, but also with the various executive orders that affect federal contractors. The executive orders that directly affect small businesses include the following:
- “Promoting Efficiency, Accountability, and Performance in Federal Contracting,” requires agencies to default to fixed-price contracting to protect taxpayer dollars and hold contractors accountable.
- “Addressing DEI Discrimination by Federal Contractors” created new contractual obligations for federal contractors and subcontractors — violations of which risk termination, False Claims Act liability, and debarment.
Previous EOs are also reshaping procurement more broadly, and will see an increase in Other Transactions and Prototyping, use of GWACs, GSA schedules, and SBIRs/STTRs.
YTD, we have seen contracts to small businesses reach $62.5B. With the 90-day delay in reporting defense awards, this number will definitely increase – the question is whether small businesses will maintain their share of the federal market or whether we will see a consolidation in contractors, larger vehicles, and increased use of innovative procurement solutions.
The federal market continues to remain one of the largest and most resilient markets, but success is not guaranteed based on a company’s size or certifications. In today’s environment, success increasingly relies on paying attention to the federal spending trends, identifying the shifts early, and aligning capabilities to changing agency priorities and procurement strategies.
Note: Analysis is based on GovSpend’s federal platform, Fedmine’s analysis of FPDS spend data.
About the Author: Archisha Mehan